Tuesday, August 4, 2009

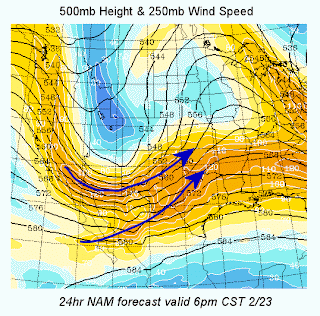
Isotachs


Isotachs are lines on a given surface connecting points with equal wind speed. This is a isotach map of the Western United States.

Image Source: http://www.underthemeso.com/blog/wp-content/uploads/entry_20070223_1.gif

Isobars

This isobar map shows sea level pressure for a given study area for the UK and Ireland. Isobars are lines of equal pressure, and joins points which share that share values.

Image Source:http://www.weatheronline.co.nz/reports/wxfacts/isobars1.gif

LIDAR

This LIDAR image is of ground zero in New York City. LIDAR stands for light detection and ranging, and is used to determine heights of features on the earth surface from an aerial perspective.

Image Source: http://www.math.ucdavis.edu/~widemann/research/Ground_Zero_Lidar.jpg

Doppler Radar

This is a Doppler radar image of central Florida during a hurricane. A Doppler radar uses sound waves to visually depict weather patterns. Weather casters use this technology to predict and explain weather.

Image Source: http://www.weatherusa.net/blog/images/doppler-orlando-1943.gif

Black and White Aerial Photo


This black and white aerial photo shows an birds eye view of a city. These photos are only used by few, as now we have color, infrared and many other aerial sensing techniques.

Image Source: http://www.fas.org/irp/ imint/docs/rst/Sect21/BloomAerial4.JPG

Infrared Aerial Photo


In this infrared photo, you can see this city from an aerial perspective. The infrared camera captures light in the invisible infrared band of light. Geographers will usually use infrared to study land cover and plant nehavior.

Image Source: http://www.onlakepartners.org/gif/p1101d.gif

Cartographic Animation


This animation is of Hurricane Katrina. A cartographic animation makes it easier to study a particular spatial feature in greater detail than normal. In this case, weather casters can study this and predict future hurricanes.